


Trading the forex market can seem complicated for beginners but taking trading decisions becomes a lot simpler with the help of certain tools.
Live forex charts is one of the most important trading tools.
These charts help traders to analyze the current conditions in the market. They also provide insights and special clues into the outcome.
However, to benefit from the charts, you need to know well how to trade them.
To trade them, you have to learn how to access live forex charts and how to read them.
How to access live forex charts?
Before reading the forex charts, you should be able to access them.
By viewing live forex charts, you can make trading decisions from all the buying and selling activities taking place in the market.
The MetaTrader platform is one of the best trading platforms that financial market traders use.
You can use MetaTrader 4, MetaTrader 5, or MetaTrader Web Trader to view the best forex charts.
The benefit of these platforms is that traders can trade directly from the chart while viewing it.
So, when you are able to identify potential signals for trading, you can access a live order ticket for buying or selling easily.
How to read trading charts – This is how you can read charts:
The Price and Time Axis
Trading charts have ‘price’ on the vertical y-axis and ‘time’ on the horizontal x-axis. It means that we can view historical prices by moving to the left of the chart.
By zooming in or out, you can see the dates and times. The more you zoom in, the more historical price action will be visible.
In forex trading charts, the ‘exchange rate’ pricing for the market is displayed on the vertical y-axis. Keep in mind that –
● If the exchange rate falls from the left side to the right side of the chart, you can deduce that over the period or the market in a downtrend or it may also mean that sellers are in control.
● If the exchange rate rises from the left side to the right side of the chart, you can deduce that over the period of the market in an uptrend or it means that buyers are in control.
It sounds simple to some traders but it is very important because when a trend is set in motion, it can stay there for an extended period of time.
To calculate the up and down movements of a market, we have to look for exchange rate pricing and pips.
Exchange Rate Pricing – Pips
The movement of currency pairs is referred to in pip that stands for percentage in points.
It is a unit that we use to measure price movement. Four decimal places are used to measure most currencies.
However, two decimal places are used to measure any Japanese Yen (JPY) currency pairings.
Due to algorithmic trading nowadays, most platforms provide accurate pricing for trading robots so transactions can be executed within nanoseconds.
So, there is often another number within the exchange rate. However, you can ignore it while calculating pip movements.
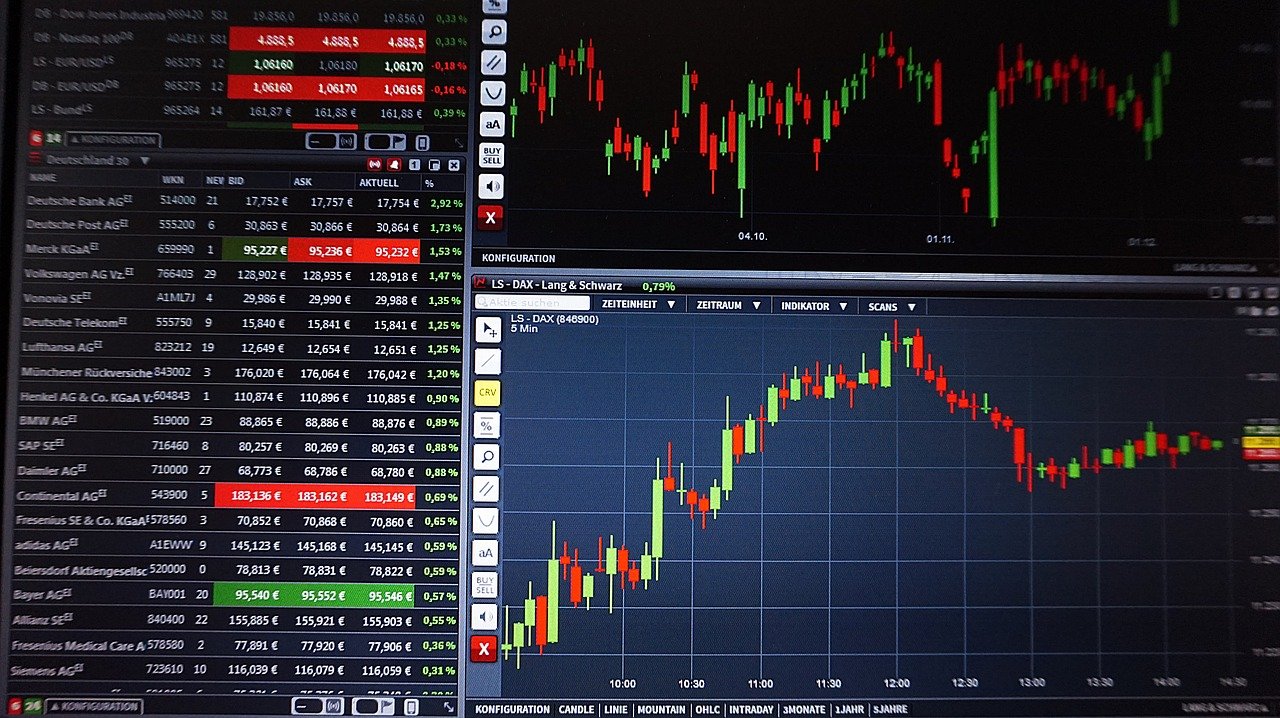
The chart below is an example –
The image is a part of a forex trading chart.
The highest price level on this chart is 1.13385. The lowest price, on the contrary, is 1.12893.
It means that the market declined by 49 pips over time because 1.1338 minus 1.1289 is equivalent to 0.0049.
It is important to determine the monetary profit or loss of a trader.
When you open a trading ticket to place a trade, you have to fill out the position size or the volume of the trade.
You can measure this in lots when 1 lot equals $10 per pip. It can mean two things –
● If you buy at 1.1338 and sell at 1.1289, you lose 49 pips. If 1 pip is worth $10, then you lose $490 (49 pips x $10).
● If you sell at 1.1338 and buy back at 1.1289, you gain 49 pips. It means that a profit of $490 could have been made.
This is a very simple example.
The figures may vary based on the currency pairs you trade and also on your position size.
Another essential component for the success of long-term trading is risk management.
With free forex charting software, you can read the best free forex charts easier.
The better you become in trading free forex charts, the higher your success rate in trading goes.
So, the first thing you need to do is learning to access and read lines, bars, and candlestick charts.


Recent Comments